POPS’ Methodology:
The Department of Parks asserts that the Population Based Level of Service (LOS) is valid in quantifying the need for recreational facilities more so than actual supply and demand. And it is true that it is a valid methodology.
However, this methodology as stated by the expert consultants who worked on POPS, that LOS standards are based on supply and demand.
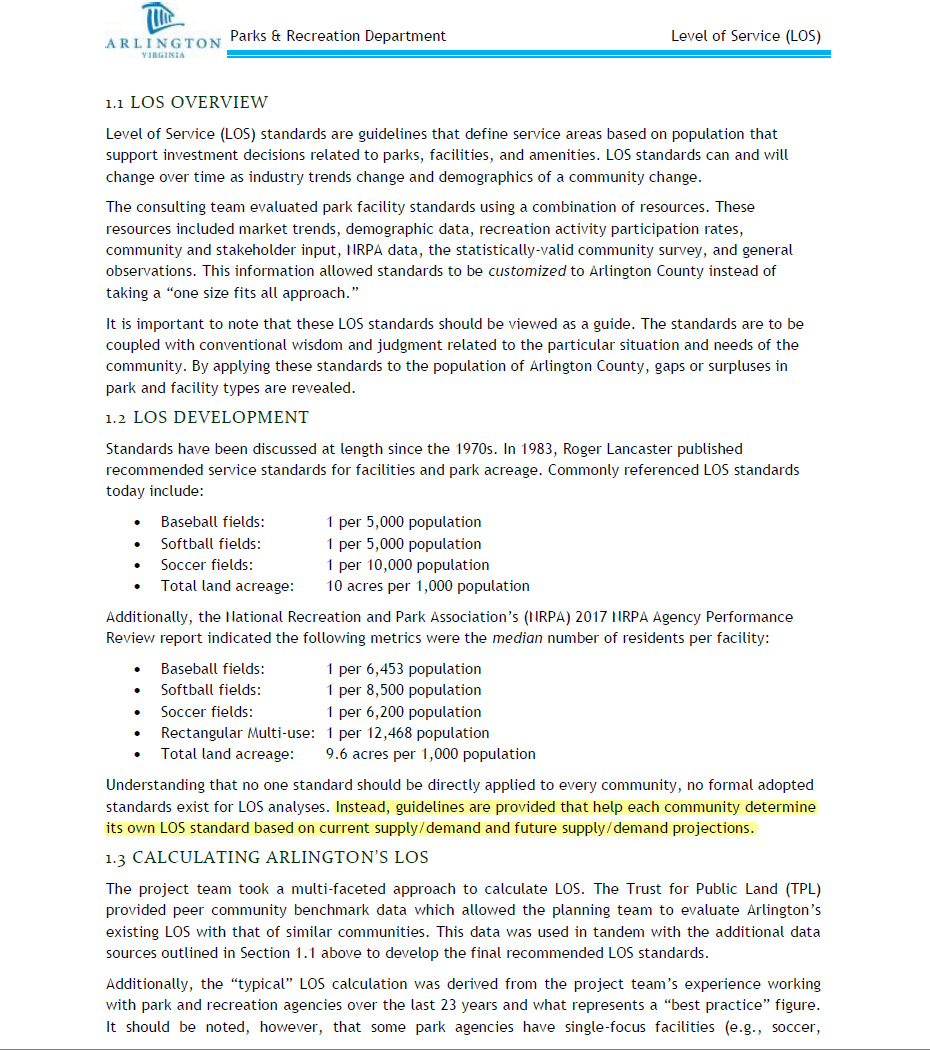
“Each community determine its own LOS standard based on current supply/demand and future supply/demand projections“
View the entire consultants’ methodology statement, POPS_LOS Methodology_171220

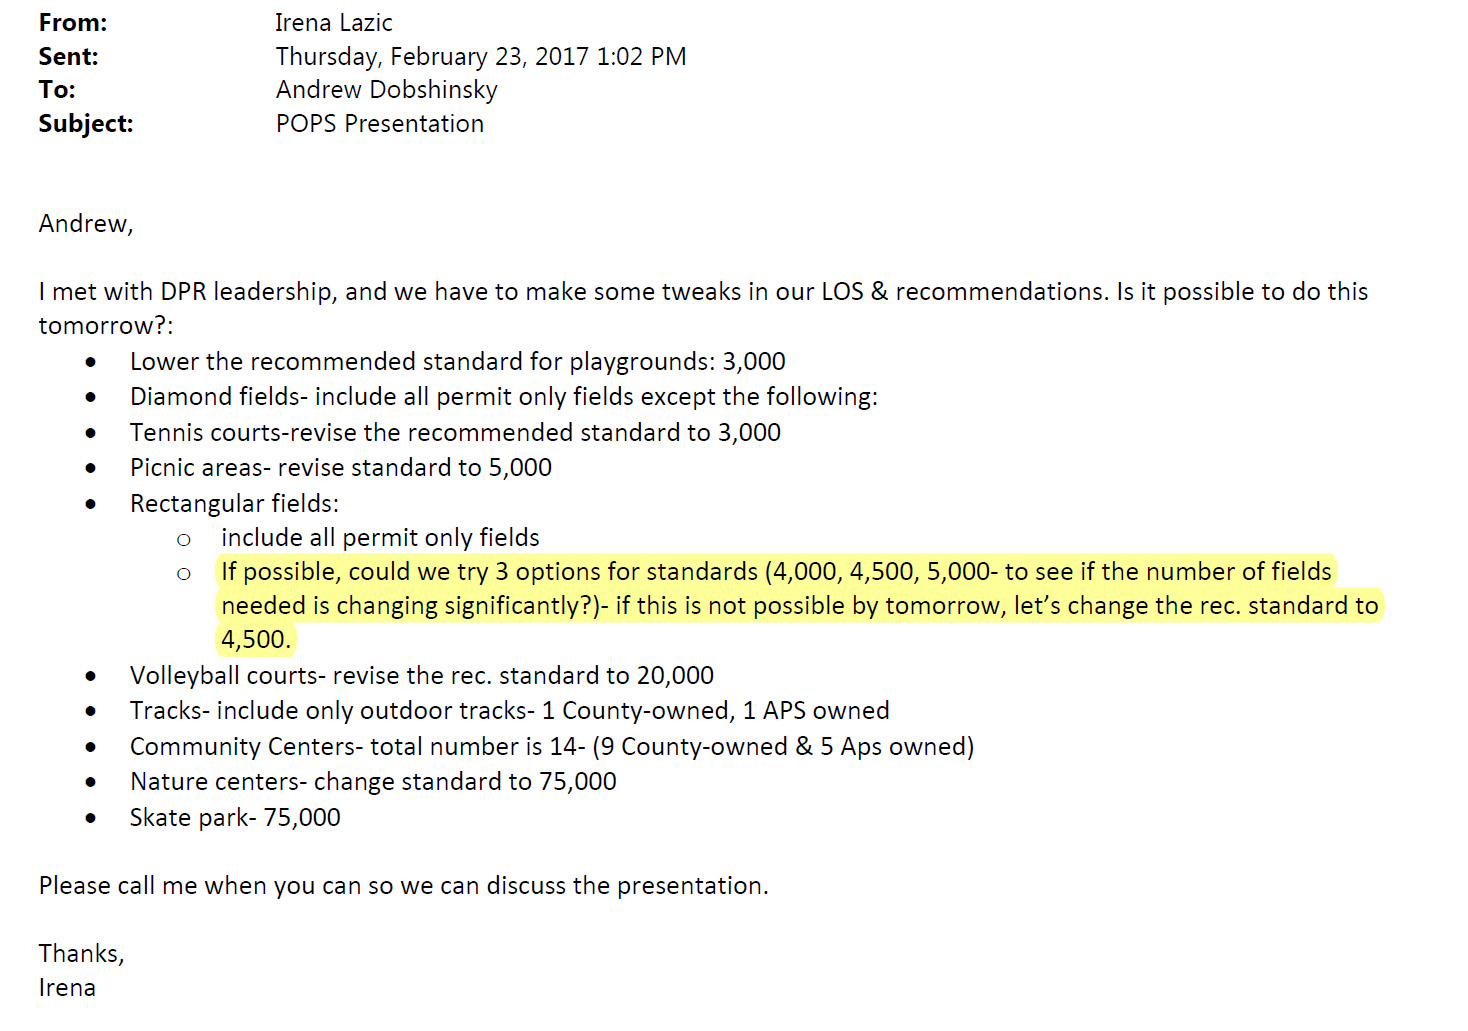
Instead the recommendations for the Population Based Level of Service were arbitrarily tweaked.
They even considered whether to have rectangular field “needs” listed as 1 field per 4000 people or 1 field per 4,5000 or 1 field per 5,000 people. “Talks” with DPR leadership and what they wanted determined the Level of Service. At the end of the day, these recommendations have no data about how often they are used/ how much they may be needed in the future.

However, supply & demand data DOES EXIST, has not been made public in the POPS process or any public process conducted by DPR.
But this data exists. DPR has it in abundance. So why is none of it being made part of the Population Based LOS recommendations for Arlington’s 20 year master plan or part of any review which suggests the need to retain, expand and add millions of dollars in improvements like synthetic turf and lights?
Experts on Population Based LOS
The PROS Consulting group was hired by Arlington to help review field and park facility data and develop recommendations. PROS Consulting has performed similar work for other localities and much of the disclosure of PROS methodology in other projects appears in the methodology statement provided to Arlington.
Other Localities Using Population Based LOS
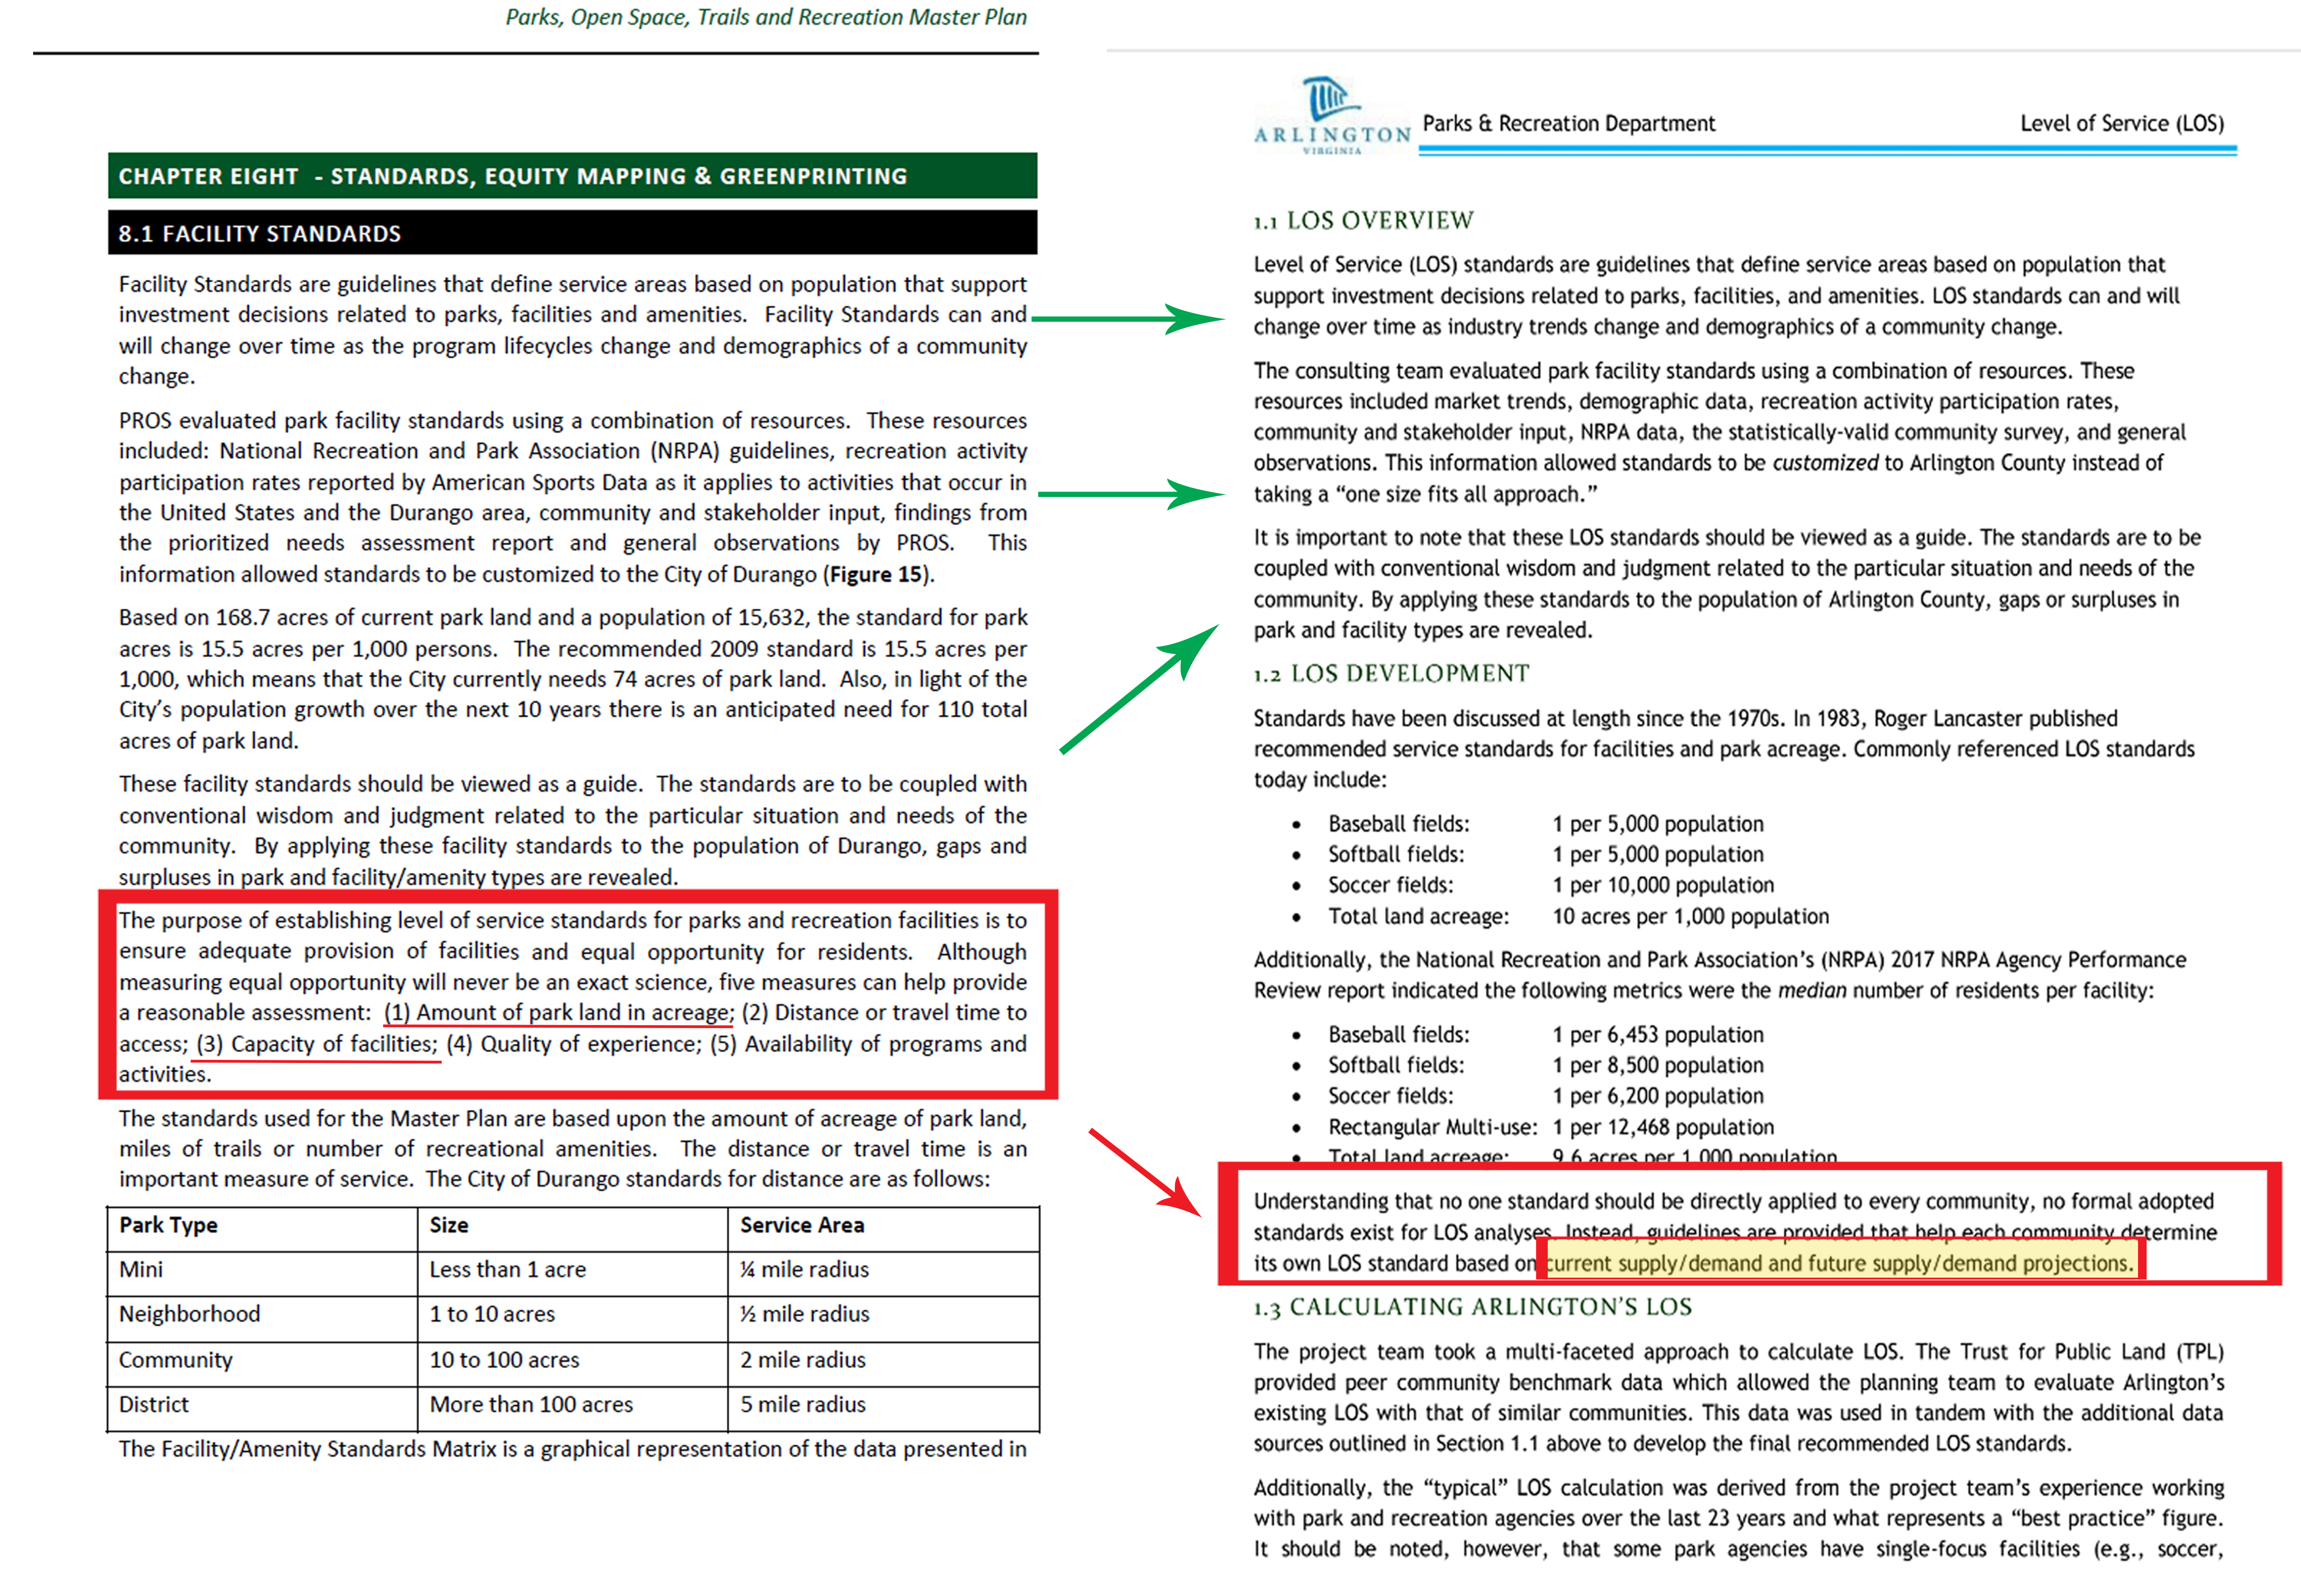
For Durango, Colorado park system (8.1 Facility Standards, page 157) , PROS Consulting also states the need for supply & demand (capacity) data.
“The purpose of establishing level of service standards for parks and recreation facilities is to ensure adequate provision of facilities and equal opportunity for residents. Although measuring equal opportunity will never be an exact science, five measures can help provide a reasonable assessment:
(1) Amount of park land in acreage; (MISSING FROM DPR’s POPULATION BASED LOS)
(2) Distance or travel time to access;
(3) Capacity of facilities; (MISSING FROM DPR’s POPULATION BASED LOS)
(4) Quality of experience;
(5) Availability of programs and activities.”
Below are a comparison of methodology statements in their entirety for Arlington and for Durango, Colorado.
Other Experts Equally Agree, Supply & Demand Data is Necessary
The Importance of Unique Park and Recreation Standards: “Current methodology suggests each community determine their own standards or Level of Service (LOS) through detailed, time consuming, and cumbersome research including surveying of park usage and resident interests combined with an introspective insight into its own defining blend of natural, social and economic characteristics.”
(Source: Houseal Lavigne Associates is a professional consulting firm specializing in all areas of Community Planning, Urban Design, and Economic Development),
Our “Peer Cities” Use Supply & Demand Data for Facility Recommendations
When Alexandria, VA hired PROS Consultant group to evaluate their park facility needs, capacity (supply and demand) of each field was a central part of the evaluation. [Source: Comprehensive Athletic Fields Master Plan Final Report pp. 7-10)]
Why LOS does not work without the supply/demand data
When LOS standards only compare other cities and national averages ,without utilization data, there are too many faulty and potentially mis-calculated variables.
Peer Cities’ Comprehensive Park Systems: FoAHP newsletter compared other important factors such as parkland totals to “peer” cities, Arlington ranked very low in its total acreage of parkland. In fact, Arlington has 3 times less parkland than St. Paul, MN.
Synthetic Turf: For example in Arlington, synthetic turf fields were counted the same as a grass field even though more hours can be played on them. So while Arlington may have counted a synthetic turf field as 1, another city’s grass field is also counted as 1, even though Arlington’s field could be played on for many more hours.
Combination Field Calculations: In Arlington, we have actually 35 diamond fields and 20 combination fields and DPR allocates 18 of those for diamond field reservations. Meaning that during the Spring season, Arlington’s population has access to 53 diamond fields during the prime season. So in actuality Arlington’s per capita access is approximately 1 diamond field per ~ 4,000 people. How were our “peer city” combination fields calculated?
APS Facilities: How are APS facilities calculated in Arlington versus peer cities? Where peer cities’ facilities included or not?
