
Public Mis-Perception Regarding its Field Supply.
THE DATA BEHIND THE OVER-SCHEDULING AND CAPACITY ISSUES
- STAFF SPREADSHEET SHOWING OVER-SCHEDULING ACROSS MOST ALL TEAMS AND SPORTS
This has caused:
- The false appearance in the reservation system that there were many more hours being used and needed.
- Other teams were unable to schedule time on their preferred fields.
2. CONSULTANTS’ REPORTS (hired by DPR)
Consultants hired by DPR report allocation and scheduling issues. Over-scheduled fields by as much as double what teams actually use and need.
3. STAFF REPORTS ABOUT FIELDS SITTING EMPTY
One of 3 DPR staff reports showing that in-person field visits during reserved times demonstrated that no one or only a few people were actually on the field during a reserved time.
FOIA’d documents titled “Rover Reports” https://foia.arlingtonva.us/responses/entry/938/
4. PLENTY OF EVENING AND WEEKEND HOURS AVAILABLE:
A typical Spring calendar week for Adult Softball Fields:
The image below was created directly from DPR’s reservation information
- Reservations shown in dark blue.
- Red are the prime hours during the weekend and evening hours un-reserved
- Pink are the other hours which the field could be reserved. But DPR only calculates the 5pm+ hours as the field supply calling them “Hours Available”
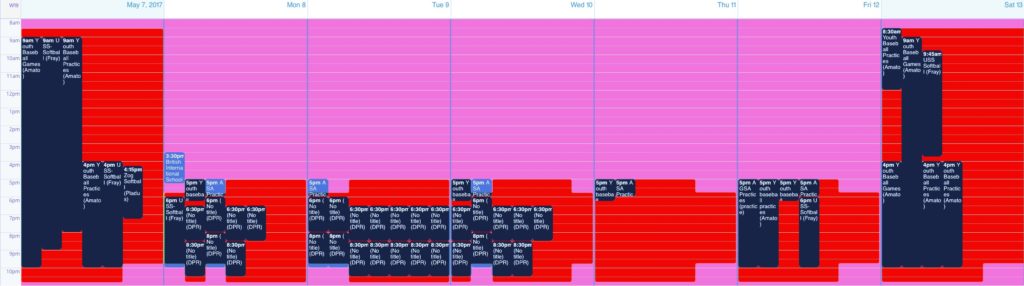
The dark blue are reservations and some of these blue reservations actually may in fact be empty fields because of excess reservations due to DPR’s mismanagement of its field inventory.
Supply and Demand
Clearly an excess of field hours based DPR’s calculations of confirmed number of teams and Arlington’s diamond field capacity per season
Demand Calculated by DPR
Demand calculated by confirmed number of teams multiplied by an exaggerated number of hours needed by most teams per week and an exaggerated number of weeks (13) in a each season most teams use.
DPR CALCULATED over 11,000 excess capacity hours for Spring and Fall seasons These 11,000 hours are during only the prime hours (5PM+ weekdays and weekend hours for two, 13 week seasons). Then the supply was capped at 900 hours which is DPR’s estimate for its field maintenance capacity per year. Meaning that no field was calculated as having more than 900 of playing time in the supply — Yet DPR calculated 11,000 EXTRA playing hours, which equals A LOT OF FIELDS SITTING EMPTY EACH SEASON.
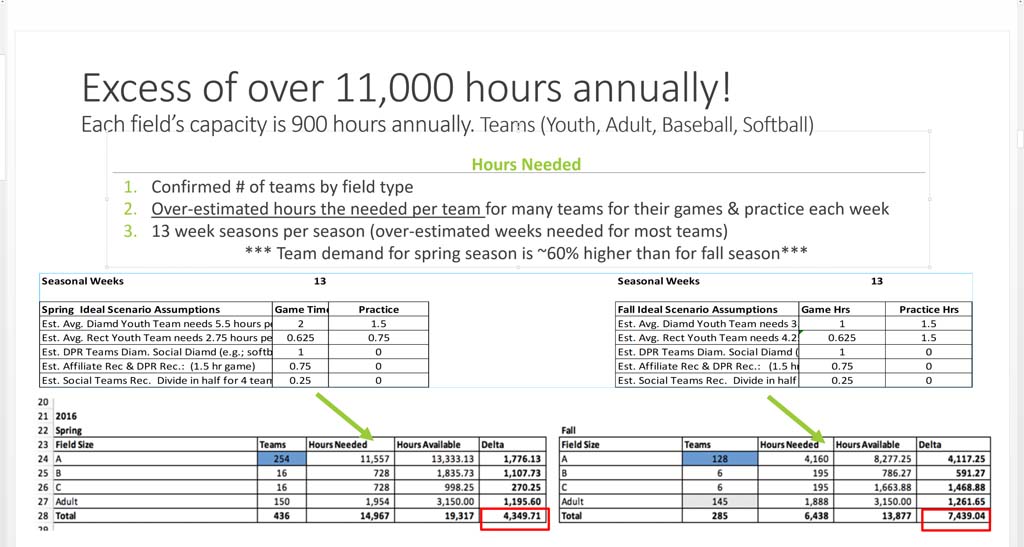
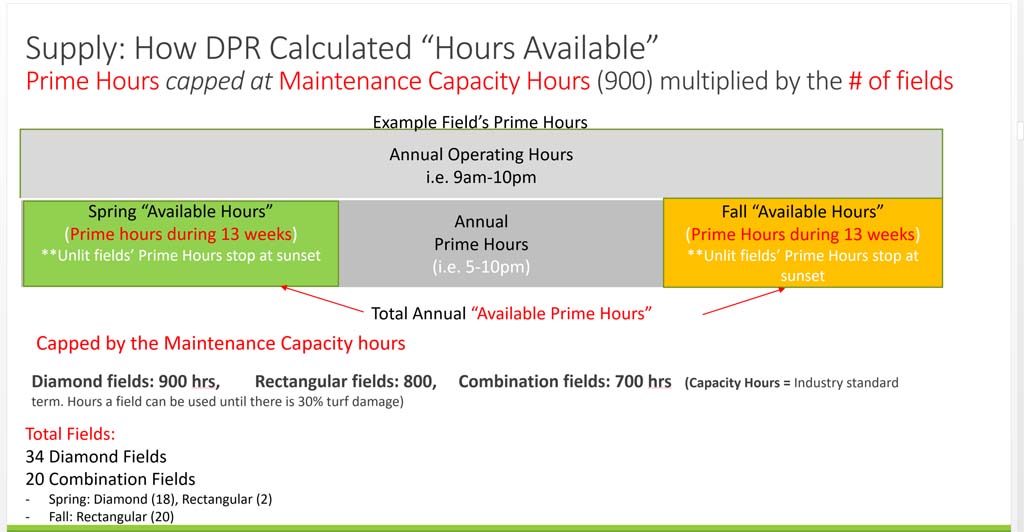
Supply Calculated by DPR:
The Prime Hours are after 5pm on weekdays and weekend hours. The excess hours are are after DPR applies an over-estimated number of demand hours from a confirmed number of teams for games and practices and over-estimating the number of weeks needed by many teams during a single season.
The Results:
The results are that there even with a significant over-estimated demand and a reduced estimates of supply during the weekend and evening hours there are more than 11 Arlington diamond fields in excess taking into account the extra hours the Gunston Synthetic turf conversion will add.
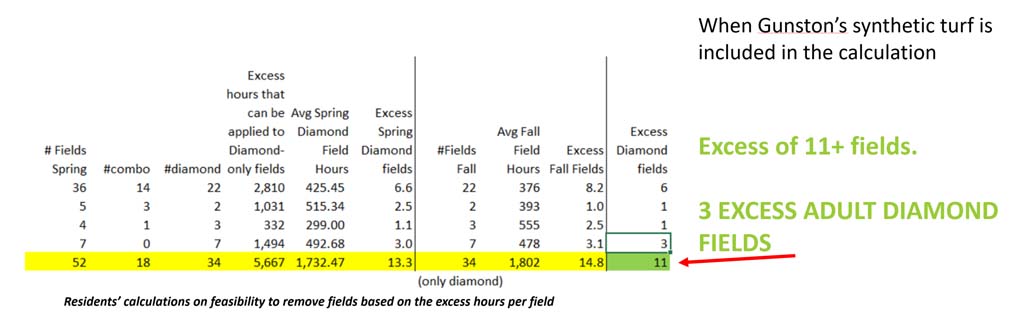
EXCESS OF AT LEAST 11 DIAMOND FIELDS IN ARLINGTON.
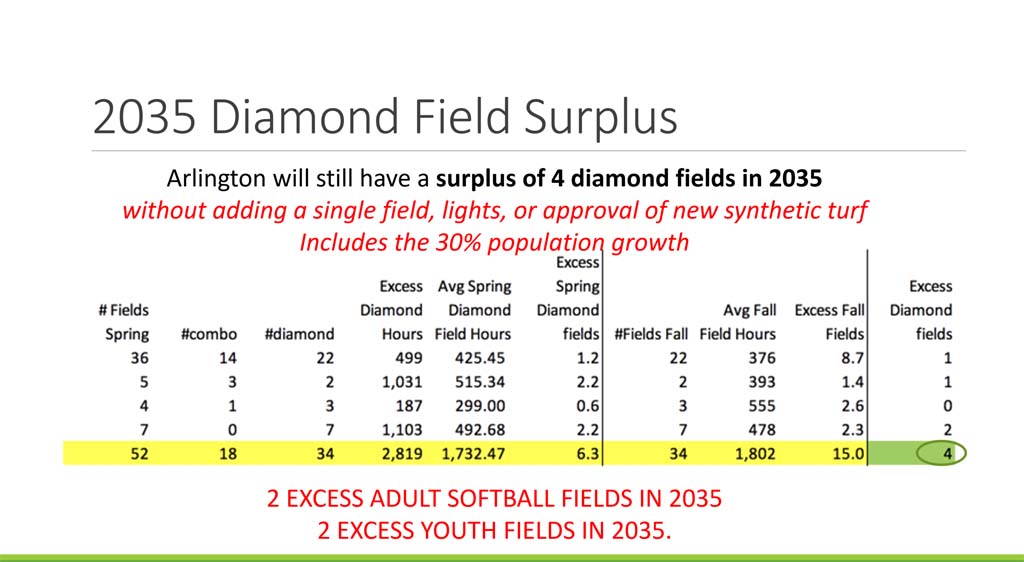
Projections:
Without adding a single diamond field to a school, adding synthetic turf or lights based on DPR’s estimate of a 30% population growth & a 20% participation growth, Arlington will still have an excess of at least 4 diamond field beyond 2035
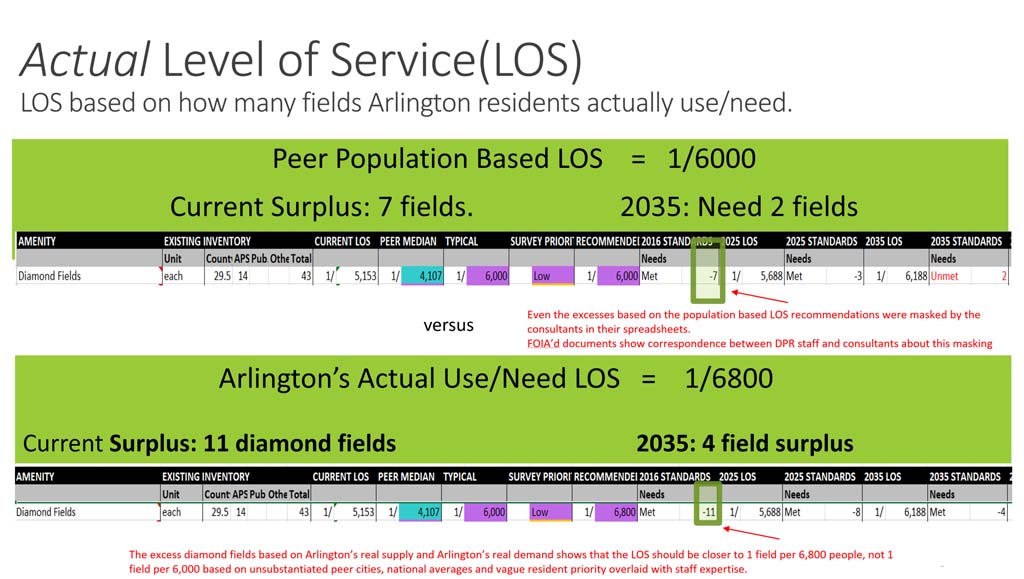
Actual Level of Service Numbers
Based on how Arlington residents use their diamond fields, not subjective numbers from what other peer cities with 3x the parkland have for facilities per capita for example.
All park facilities should be reviewed to see how facilities can be better managed for all user groups.
Can we combine or convert underutilized fields for other recreation?
Can we provide spaces in on our school properties for APS needs and space in parks for other community needs?
A summary of the Department of Parks and Recreation’s data and analyses about their field management and usage.
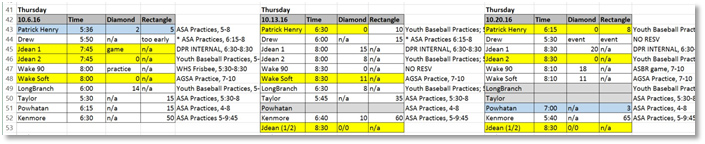
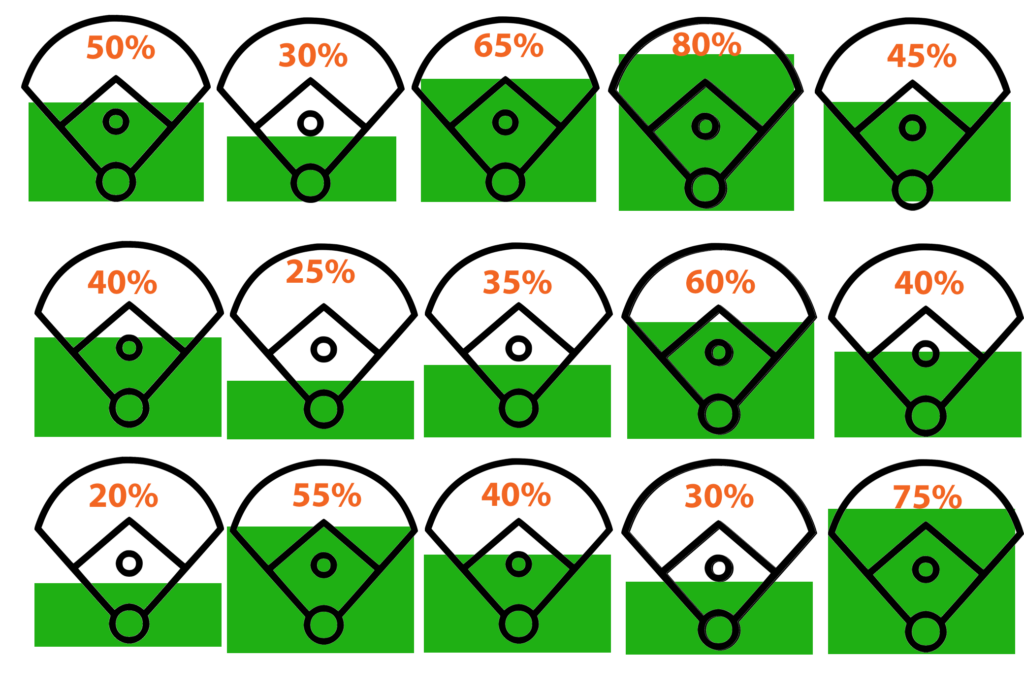
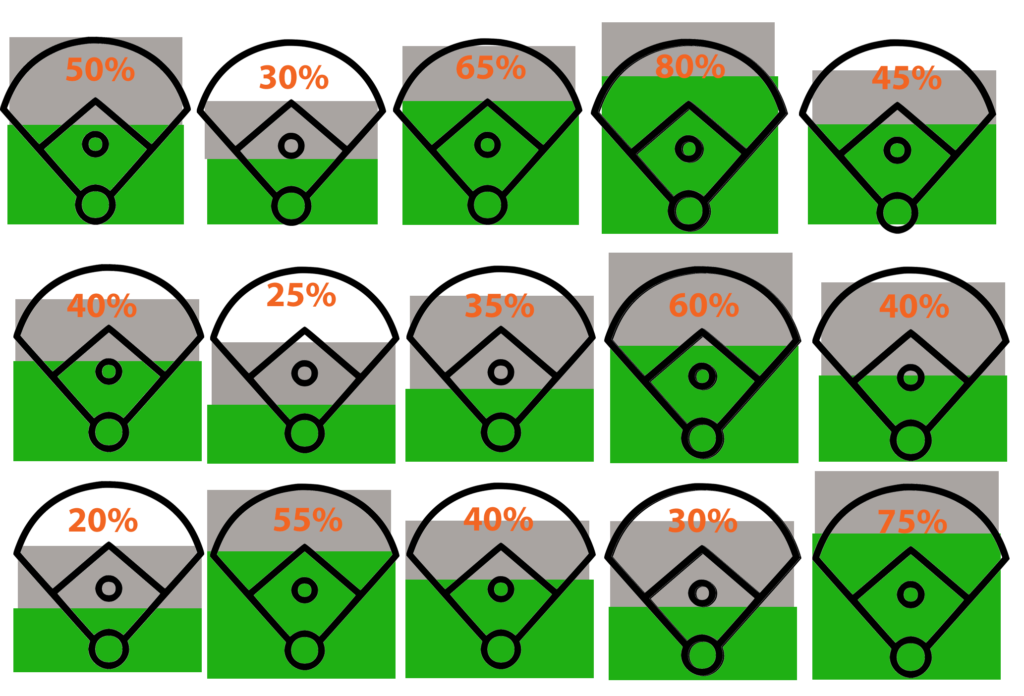
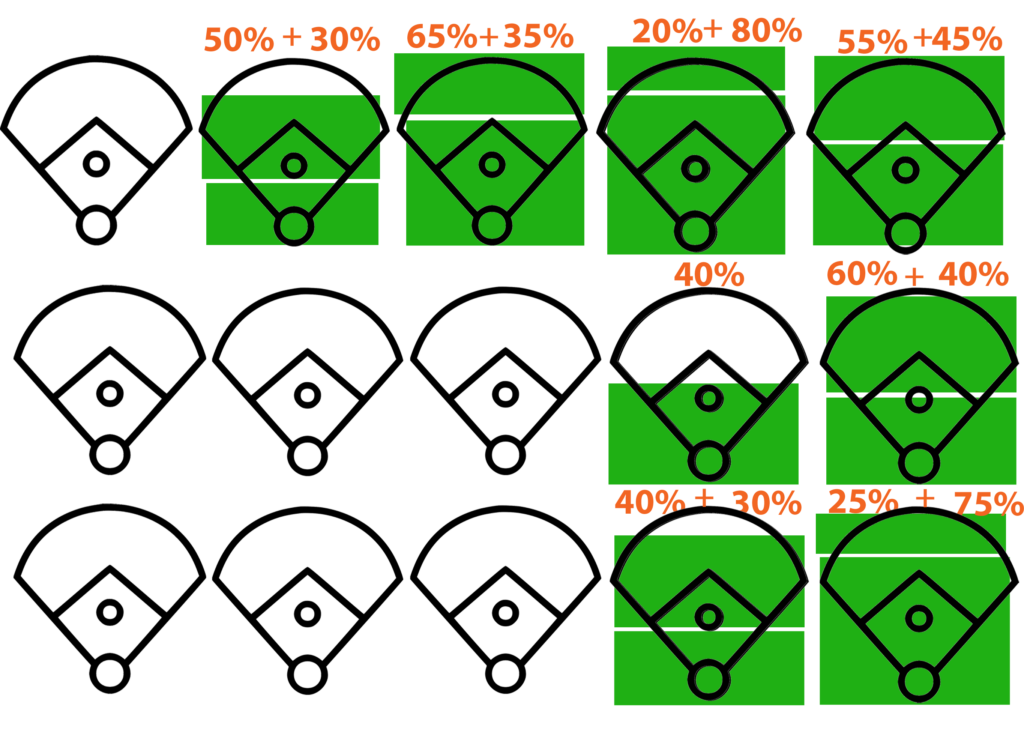
A VISUAL EXAMPLE OF HOW FIELDS ARE BEING POORLY ALLOCATED
Example of Field Usage
Example of Field Reservations
Example of Utilizing Fields To Their Recommended Capacity
LISTED BELOW ARE THE MOST IMPORTANT SPREADSHEETS AND THEIR TABS
Follow this link https://foia.arlingtonva.us/responses/entry/938/ and then look for the spreadsheet name in the FOIA documents list followed by the important tab name in that spreadsheet.
- Spreadsheet: POPS Field Est v3
- Tab “Diamond Field” projections through 2045 of actual need for diamond fields. A spreadsheet error, using Spring 2045 estimate of # of teams was used for Fall 2016 # of teams, grossly inflating the Fall 2045 estimates for Adult softball. The corrected spreadsheet error and analysis can be viewed herehttps://docs.google.com/document/d/e/2PACX-1vQxV-T9350-DdfsTRXHHUzfsUeO1QnaMEMLn5P40HhFG3ayMnZS6kj2ZIaws9JcdY2c_vsyKP2F1e-p/pub
- Rover Reports (3). Include in person visits to reserved fields for confirmation of usage.
- Spreadsheets: (1) Fall 2017 Rover Data, (2) Field Usage Rover Reports Fall 2016, (3) Field Usage Rover Reports Spring 2017.
- Spreadsheet: Field Usage Analysis FY 2017:
- Tab “All Data For Comparison”
- Columns:
- H-M = DPR calculated prime hours & capacity based on turf/grass type, lights or no lights, and sunset hours
- BF = Total prime hours available/ field.
- BD = Operating hours
- BK = total maintenance capacity hours/ field…
- Tab “Measures” shows percentage of fields under capacity
- Tabs “Cool Season Sunset, Bermuda Sunset, Synthetic Sunset (no lights)” sunset hours for 2016
- Tab: “FY 2017 reservations” any reservation information
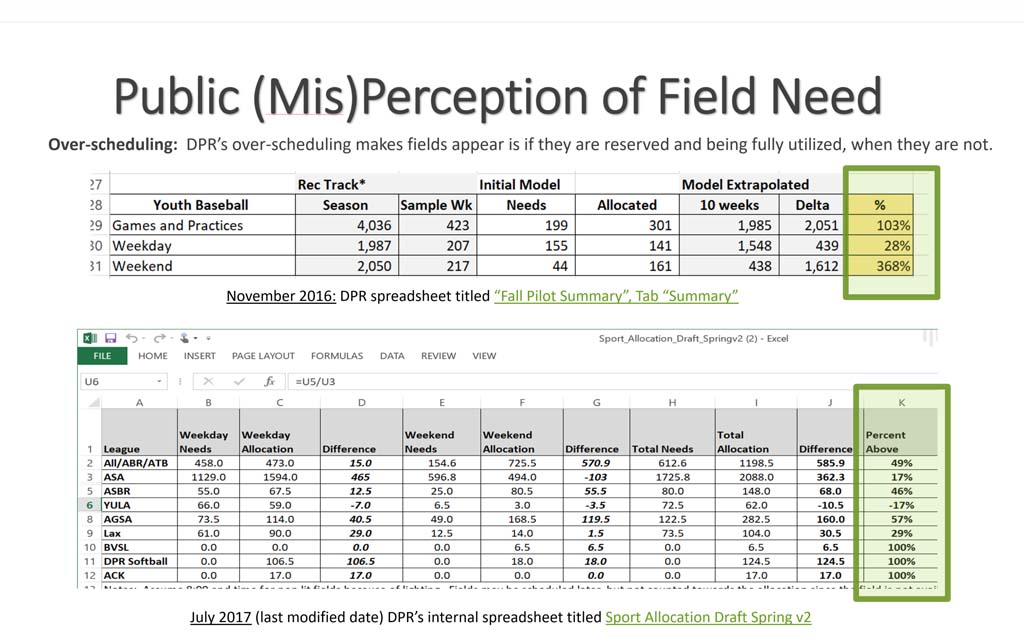
- Fall Pilot Summary
- Tab “Summary” shows allocated time vs. team need.This section shows over-allocation by DPR in their scheduling
- Sport Allocation Draft v3 (used in part for “Fall Pilot Summary” spreadsheet)
- Tab “League Input” Number of teams per league, practices, games and hours needed.
- Sport Allocation Draft Springv2
- Tab “League Input” Shows over-scheduling percentages
- 2017 Field Hours 7.31.2017
- Tab “DPR Facility Reservation Report”
- Rained Out through Fall 2017– information about grass field closures
- LOS 6-22-2017– One of the iterations of the Level of Service from the consultants.
- Green Play Consultant Reports Outlined issues of over-scheduling, field allocation, prioritization of league types, etc…starting in 2015.